Housing Market vs. 2008: Why This Stock Market Correction Is Different
Unraveling the Truth Behind the Fear of a Housing Market Crash
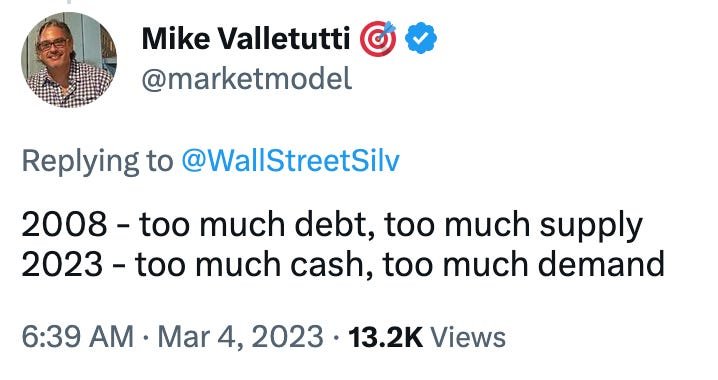
There’s nothing like social media to gauge sentiment, and recently, warnings of a housing market crash worse than 2008 have dominated discussions. However, while surface-level similarities exist—rising rates and high home prices—the underlying economic conditions today are vastly different.
The Real Economic Picture Behind the Housing Market
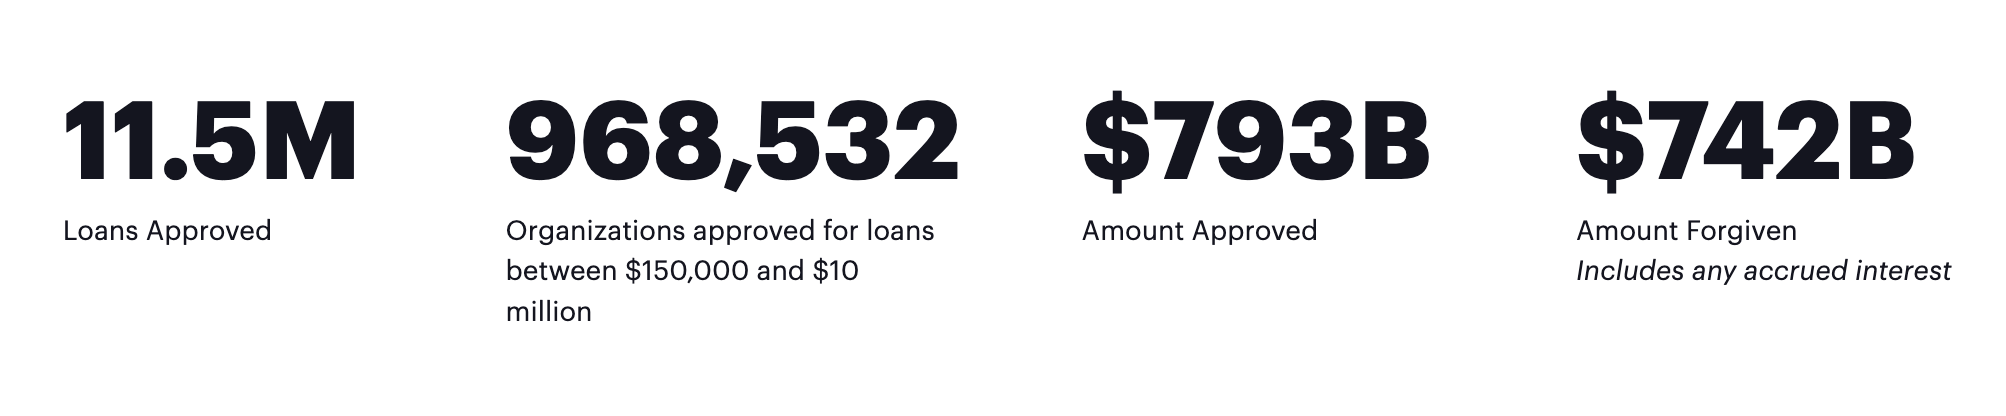
The 2020-2022 macro cycle was entirely man-made, creating significant economic distortions. Unlike 2008, when unsustainable lending practices and speculative home purchases led to mass foreclosures, today’s homeowners are in a much stronger financial position. Employment remains at max levels, and many benefited from stimulus checks, PPP loans, and other economic supports. This means that despite home price corrections, most homeowners are not forced to sell, unlike in the Great Financial Crisis.
A slowdown is inevitable, but it won’t mirror 2008’s collapse. Many homeowners locked in ultra-low mortgage rates, making them unlikely to sell at a loss. Unlike in 2008, when banks and speculators held excess housing inventory, today’s homeownership market is primarily made up of individuals who are financially stable.
The Bearish Narrative & the Misuse of Data

Household Debt Service Payments as Percent of Disposable Personal Income
What I love about statistics, and why I punished myself for another 6 quarters getting post-grad engineering degree in Probability and Statistics, is that a datapoint taken absolutely can be misleading. Data is relative, especially with time-series, and if combined properly can actually be predictive. So let’s look at the absolute datapoint: Personal Savings Rate.

FRED Personal Saving Rate 2018 - 2023
First thing I often say when I’m handed a post-2019 chart is “zoom out”, treating 2020-22 as some artificial outlier that’s easy to find the data on any chart. Zooming out to pre-2008 gives the forest view, and it shows a savings rate near the lows. But what stands out is the two spikes that doubled and tripled the savings - how does that compare historically? Zoom out.

FRED Personal Saving Rate 2008 - 2023
Zoomed out and the unprecedented gift to already working families and businesses is clear to see. It’s why consumers remain strongly consuming, perplexing the forecasters.

FRED Personal Saving Rate 1960 - 2023
Bears have pointed to declining personal savings rates as a red flag, but context is key. Savings rates spiked in 2020-2021 due to government stimulus, making today’s declines seem extreme. However, when zooming out, the savings rate is simply normalizing to pre-pandemic levels. Furthermore, much of this money was put into assets, including real estate, helping sustain the housing market.
Rising rates also gave a risk-free alternative to 0% savings accounts, with 5% from 2-yr notes or tax-free munis to 8% structured notes. That cash was finally put to work, but it will mature and be available as future savings. The plunge in Savings Rate looks like the inverse of the spike in Govt Securities.

FRED Household Government Securities & Municipal Securities; Market Value Levels 2000 - 2023
Similarly, rising credit card balances are often cited as a warning sign, but history shows that consumer debt typically increases until a recession, rather than causing one. The overall debt-to-income ratio remains healthy, supporting continued consumer spending.

FRED Household consumer Credit 1950 - 2023
And one of the most upside-down charts is how Net Worth surged coming out of a “recession”, which should tell you it was a recession in name only. In fact, as you compare to prior shaded periods, you should reverse your expectations as to what follows.

FRED Household Net Worth 1988 - 2022
What This Means for Stock Market Correction & ES SPX Trading Signals
The stock market correction is adjusting to these macro shifts, but it’s not a sign of impending economic doom. MarketModel Trades continues to track ES & SPX trading signals, identifying high-probability trading opportunities amid market fluctuations.
The key takeaway?
While the housing market will cool, it’s not collapsing, and broader economic conditions remain resilient.
For traders looking to stay ahead of market movements, subscribing to our trading signals can help navigate volatility with confidence.
If you're ready to gain a deeper understanding of these cycles and position your portfolio for the next big move, join us. Read success stories from clients profiting from our strategies during a stock market correction and discover how you can turn macro trends into trading opportunities.
Explore more on our website and see how MarketModel Trades can be your trusted guide through these evolving market conditions.