The Recession Ahead: Navigating the Market Correction
Slowing Growth After 'Beyond Peak Cycle' Is Not Bearish – Navigating a Stock Market Correction with SPX Trading Signals
Every smart person has forecast a recession—corporate earnings declining, and therefore, stock prices falling. That part is straightforward. What many miss, however, is the nuanced reaction of the market to these shifts. In recent years, while many anticipated a full-blown recession, the market correction we witnessed was far more complex than a simple downturn.
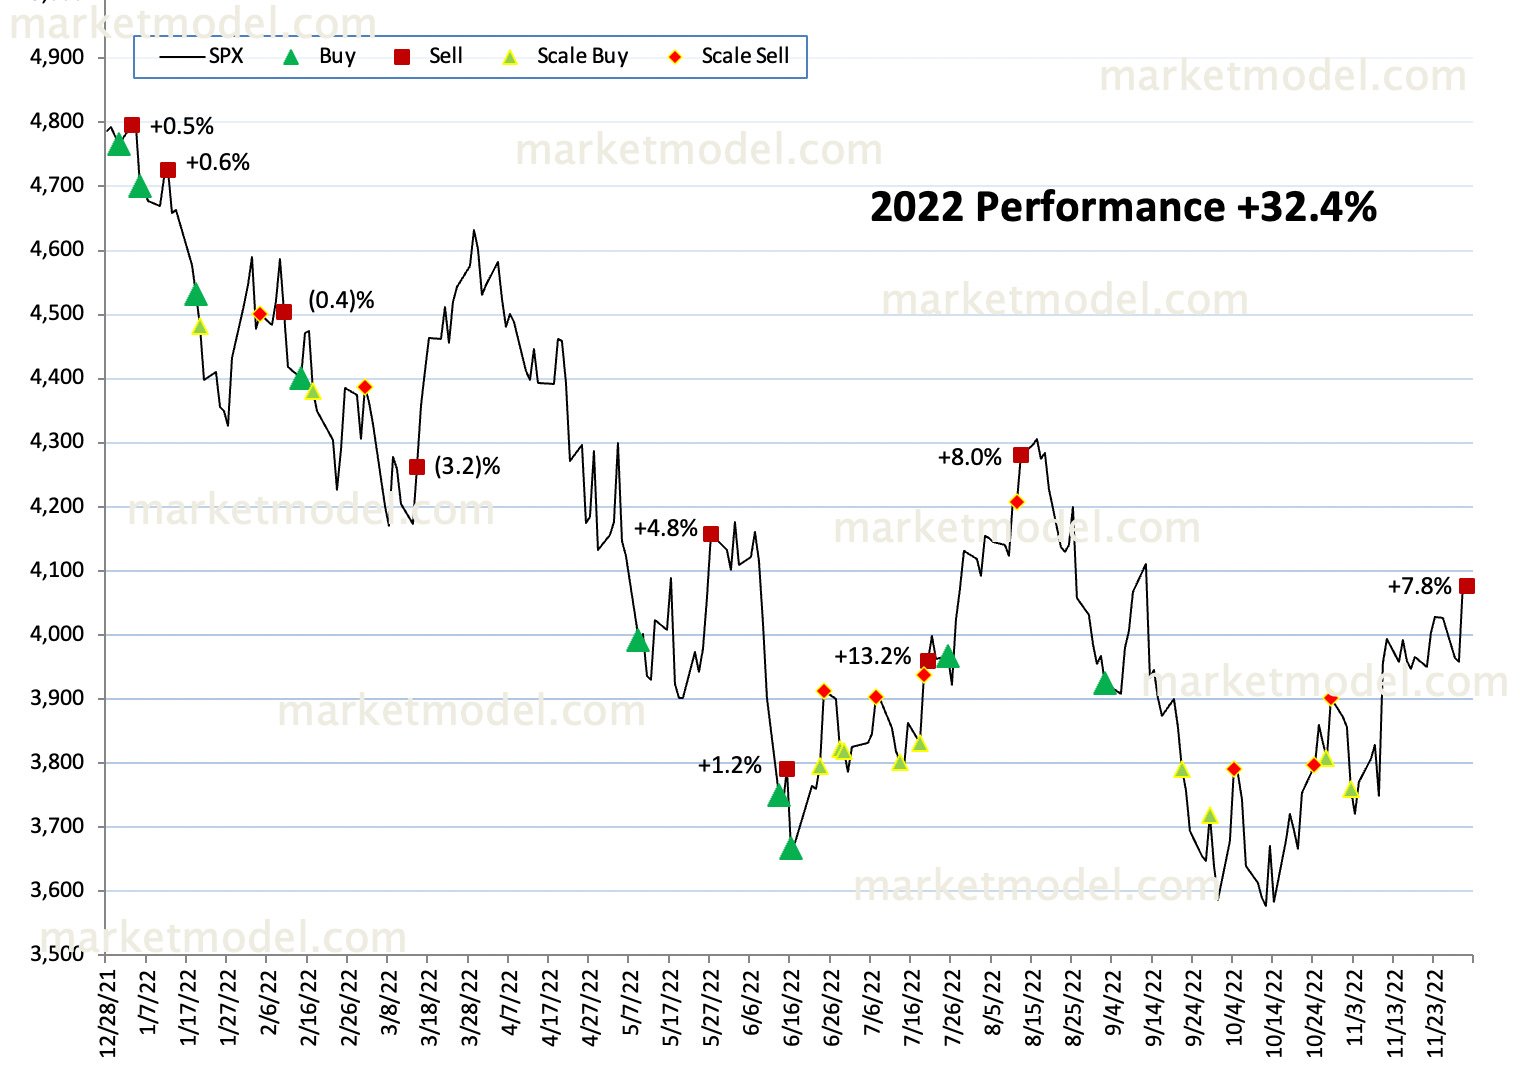
Markets began to signal a slowdown in growth as early as last March when the SPX was at 4600. Our macro models, which measure cycles transitioning between Improving and Declining phases, registered a deep dive in values, with prices tumbling to 3600 by June. With the Fed just starting its tightening cycle, predictions of a 3200 level for the second half of 2022 flooded in. Yet, despite the aggressive monthly series of 75 bps hikes—the most aggressive in history—the anticipated recession never materialized. In fact, GDP grew at an unexpectedly high 12% annually in the latter half of 2022, the antithesis of a recession scenario.
Throughout this period, MarketModel consistently captured high-probability scale trades every time SPX neared 3800 (see green triangles on graph). These SPX trading signals demonstrated that even amid a potential stock market correction, macro conditions remained robust, keeping prices from plunging to 2022 lows.
MarketModel Trades Trading Signal Performance in 2022
Recession forecasts did force a necessary adjustment in employment. The surge in hiring during 2020-21, which pushed companies beyond peak capacity, eventually led to a wave of 10% layoffs. However, these cuts were merely a corrective measure rather than a signal of an impending economic collapse. They helped temper unsustainable wage gains and put a stop to rampant inflation in the labor market, thereby softening the blow to record earnings.
The pattern is clear: an accelerated macro cycle—pushed beyond its natural peak by man-made factors—adjusts downward just as swiftly as it surges. The key to understanding this lies in recognizing that a bull market correction isn’t synonymous with disaster. Rather, it represents a necessary recalibration. For instance, while growth was once "too hot," a transition to slow growth, where GDP moderates to more sustainable levels, sets the stage for healthier, more balanced market conditions. In essence, a bull market correction paves the way for the SPX to stabilize and eventually resume its upward trajectory.
TNX CBOE 10-year US Treasury Yield Chart
And now interest rates, which everyone predicted would be pushed higher for longer. Since last June, I’ve been a fan of the 1994/95 analog for both Macro and Fed tightening. SPX bottomed in Dec 1994, and during this same period 10yr peaked and trended lower throughout 1995 (see below). If the Beyond Peak Cycle extends to rates, that would mean an adjustment lower. Use the 100 day MA as proof that the analog is still working.
I always conclude with, “what changes my mind is the Macro data.” I was almost certain last March that a recession would hit in 2022, but the evolving data changed that view. Today, as we observe interest rates and macro trends, the analog from 1994/95 still resonates—if the Beyond Peak Cycle extends to rates, then we might see an adjustment lower. Tools like the 100-day MA continue to validate this approach.
For more insights, check out our Sunday Macro Insights to see our detailed analysis and Our Performance page to learn how our SPX trading signals have helped shape smarter strategies during market corrections.
Discover actionable trading signals and gain the edge you need with MarketModel Trades. Join us today!

